Outrank AI

The most popular CLV advice is to find your highest-value customers and spend more to retain them. That can be an expensive mistake. If those customers would've reordered anyway, a retention discount reduces profit without changing behavior. A useful customer lifetime value model estimates discounted contribution under uncertainty, then helps you decide whether an intervention will earn more than it costs.
Table of Contents
What a Customer Lifetime Value Model Actually Measures
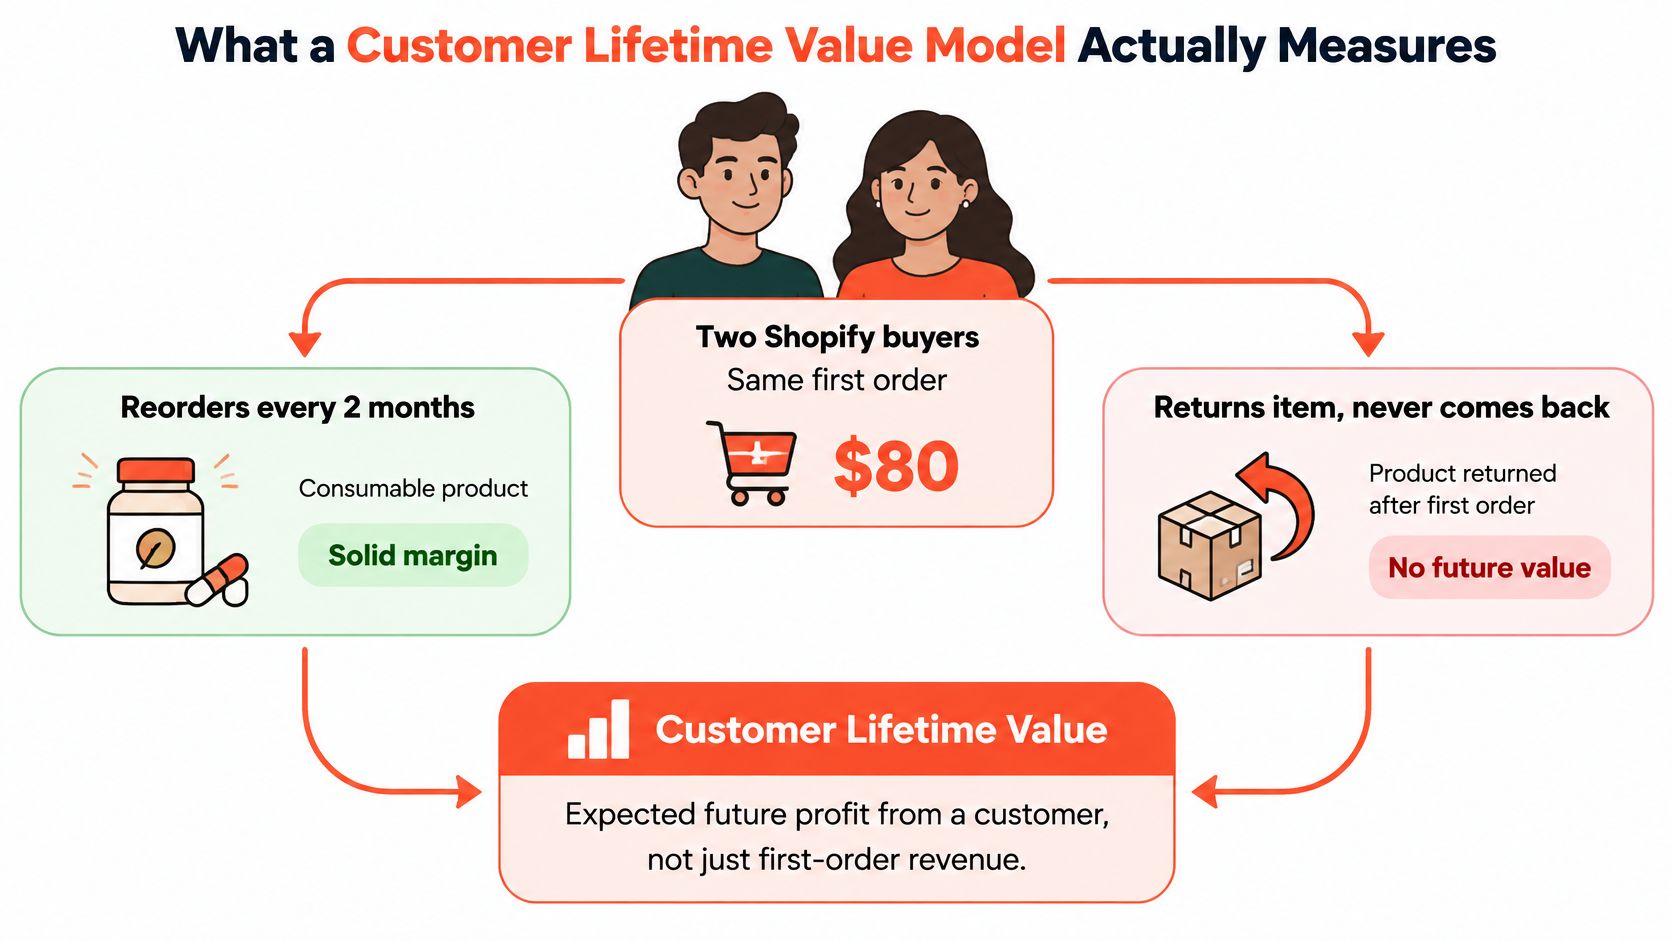
Say two Shopify buyers place the same first order. One buys a consumable, replenishes it regularly, and rarely needs support. The other returns the product and never orders again. Their acquisition dashboards initially look identical, but their economics aren't.
Customer lifetime value is expected discounted contribution, not cumulative sales. Contribution means the money left after the costs associated with serving those orders. Depending on your accounting setup, that includes product cost, payment fees, fulfillment, shipping subsidies, returns, and variable service costs.
The distinction matters when a growth lead asks whether to increase acquisition spending. First-order revenue tells you what customers bought. It doesn't tell you what the business can afford to spend acquiring more customers like them.
Value includes timing and probability
Project contribution for each future period, weight it by the probability that the customer remains active, and discount it because money received later is worth less than money available today. Subtract acquisition cost when reporting net customer value.
Think of an annuity: last month's payment isn't the value of the entire contract. Equally, a forecast of future payments isn't cash already collected. Your dashboard should preserve that distinction.
At the business level, customer equity combines the lifetime values of existing customers and customers you expect to acquire. That's useful for planning, but it requires more assumptions than measuring contribution from customers already on the books.
Practical rule: Label every CLV number with its margin definition, forecast horizon, and treatment of acquisition cost.
Make the metric usable
In the 2024 Language of Effectiveness survey published by Marketing Week, 26.2% of more than 1,200 marketers measured customer lifetime value as an effectiveness metric. That finding doesn't establish why any particular team favors first-order ROAS, but it shows that CLV measurement isn't universal.
Don't replace a familiar dashboard with an unexplained score. Give finance, acquisition, and lifecycle teams a shared definition they can reconcile to order economics. Otherwise, each team can report an improvement while using a different meaning of value.
Formulas for Every Customer Lifetime Value Model
Historical value = sum of observed contribution − acquisition cost.
Simple predictive CLV = AOV × purchase frequency × margin rate × expected lifespan − CAC.
The shortcut is useful for a planning conversation, provided everyone understands its limits. Keep frequency and lifespan in matching units, and don't treat a guessed lifespan as an observed customer relationship.
Start with the economics
For a hypothetical DTC store, multiplying average order value by annual purchase frequency estimates annual revenue per customer. Applying a margin rate converts that revenue into an approximate profit contribution. Multiplying by expected customer years and subtracting acquisition cost produces a simple estimate.
If you use gross margin, however, the result still excludes variable costs below gross profit. For a Shopify budget decision, replace it with contribution margin wherever possible. A brand that subsidizes shipping heavily shouldn't use the same margin assumption as a brand whose customers cover delivery.
The general discounted expression is:
Net CLV = sum of expected contribution in each future period, discounted to today − CAC.
Gupta and Lehmann's 2003 Journal of Marketing Research study treats customer value as discounted future earnings and reports a constant-margin, constant-retention multiple of 1.07 to 4.50 times periodic margin across typical retention and discount-rate combinations.
Customer lifetime value model formulas
Model | Working expression | Use it when | Main failure |
|---|---|---|---|
Historical | Sum of past contribution margin minus acquisition cost | The customer history is already complete | Ignores future orders |
Simple predictive | (AOV × frequency × gross margin × lifespan) − CAC | A fast planning estimate is enough | Treats averages as if they were individuals |
Infinite-horizon multiple | Periodic margin × retention / (1 + discount rate − retention) | Margin and retention look stable | Misleads when retention deteriorates; mathematically fails when retention meets or exceeds 1 + discount rate |
Cohort | Sum of discounted cohort contribution ÷ original acquired buyers, minus CAC per buyer | Comparing channels, months, or offers | Hides customers who could be changed by a treatment |
BG/NBD or Pareto/NBD | P(alive) × expected orders conditional on being alive × contribution per order, discounted | Repeat purchase is irregular and churn is unobserved | Unreliable on a cold start and requires maintenance |
The infinite-horizon expression values future periods under a particular timing convention. Add current-period contribution separately if your definition includes it, and subtract CAC separately when calculating net value. Retention and discount rate must describe the same period.
For probabilistic models, check the software's output definition. If expected future orders already incorporates the probability of being active, don't multiply by that probability again.
For a complementary walkthrough of calculation inputs, Come Together Media's customer value guide is a useful resource to review alongside your finance team's margin definitions.
The formula isn't the hardest part. Choosing defensible inputs is. Identical revenue can conceal different product margins, return costs, service requirements, and repeat-purchase odds, so a revenue-only calculation can rank customers incorrectly.
Historical Predictive and Cohort Methods Side by Side
Choose the model for the decision in front of you. A channel-budget question needs comparable acquisition cohorts. A subscription-renewal question needs observed renewal behavior. Neither automatically requires an individual lifetime ranking.
A young store can begin recording cohort contribution immediately, but it can't establish a mature repeat-purchase curve before customers have had time to reorder. Treat early results as incomplete observations, not evidence that the customers will never return.

Which customer lifetime value model to use
Situation | Model to use | Why it fits | Do not use |
|---|---|---|---|
Store younger than one repurchase cycle | Cohort curve by first-order month | Individual histories are too short | A customer-level BG/NBD score |
Subscription with an explicit cancel | Contractual retention and renewal rate | Churn is observed | An unobserved alive probability |
Repeat consumable with no contract | BG/NBD or Pareto/NBD after several cycles | Churn is silent and timing is irregular | A single guessed lifespan for everyone |
Channel or campaign comparison | Cohort CLV by acquisition source | It compares like with like | One blended store CLV |
Allowable CAC for planning | Infinite-horizon margin multiple | It is fast and easy to explain | A ranking of individual scores |
Require the right input before trusting the output
For subscriptions, confirm that billing status reflects what happened. A cancellation, a paused subscription, and a failed renewal aren't interchangeable. A contractual model supports decisions about cadence, renewal experience, and subscriber acquisition when those events are recorded accurately.
For noncontractual consumables, customers don't announce that they've left. A skincare buyer may be replenishing slowly, buying elsewhere, or finished with the brand. Probabilistic models can help once repeat history exists, but clean customer identities and order dates are prerequisites, not cleanup tasks to postpone.
For channel comparisons, keep cohort age consistent. Comparing mature organic customers with newly acquired paid-social customers confuses time available to purchase with acquisition quality. Preserve the original acquisition denominator, including buyers who never return.
For allowable CAC, a transparent planning model often beats an elaborate score that finance can't interrogate. Test whether the recommendation survives weaker retention, lower contribution, and slower payback. A forecast can be economically attractive while still creating an unacceptable cash requirement.
Historical contribution remains useful in every setup as a reconciliation check. It tells you whether the model's starting point agrees with the order ledger, even though it can't answer what happens next.
Use the simplest model whose error wouldn't change the budget decision. Complexity is justified when it changes a consequential choice, not when it merely produces a more detailed customer ranking.
How Retention Changes Future Profit Periods
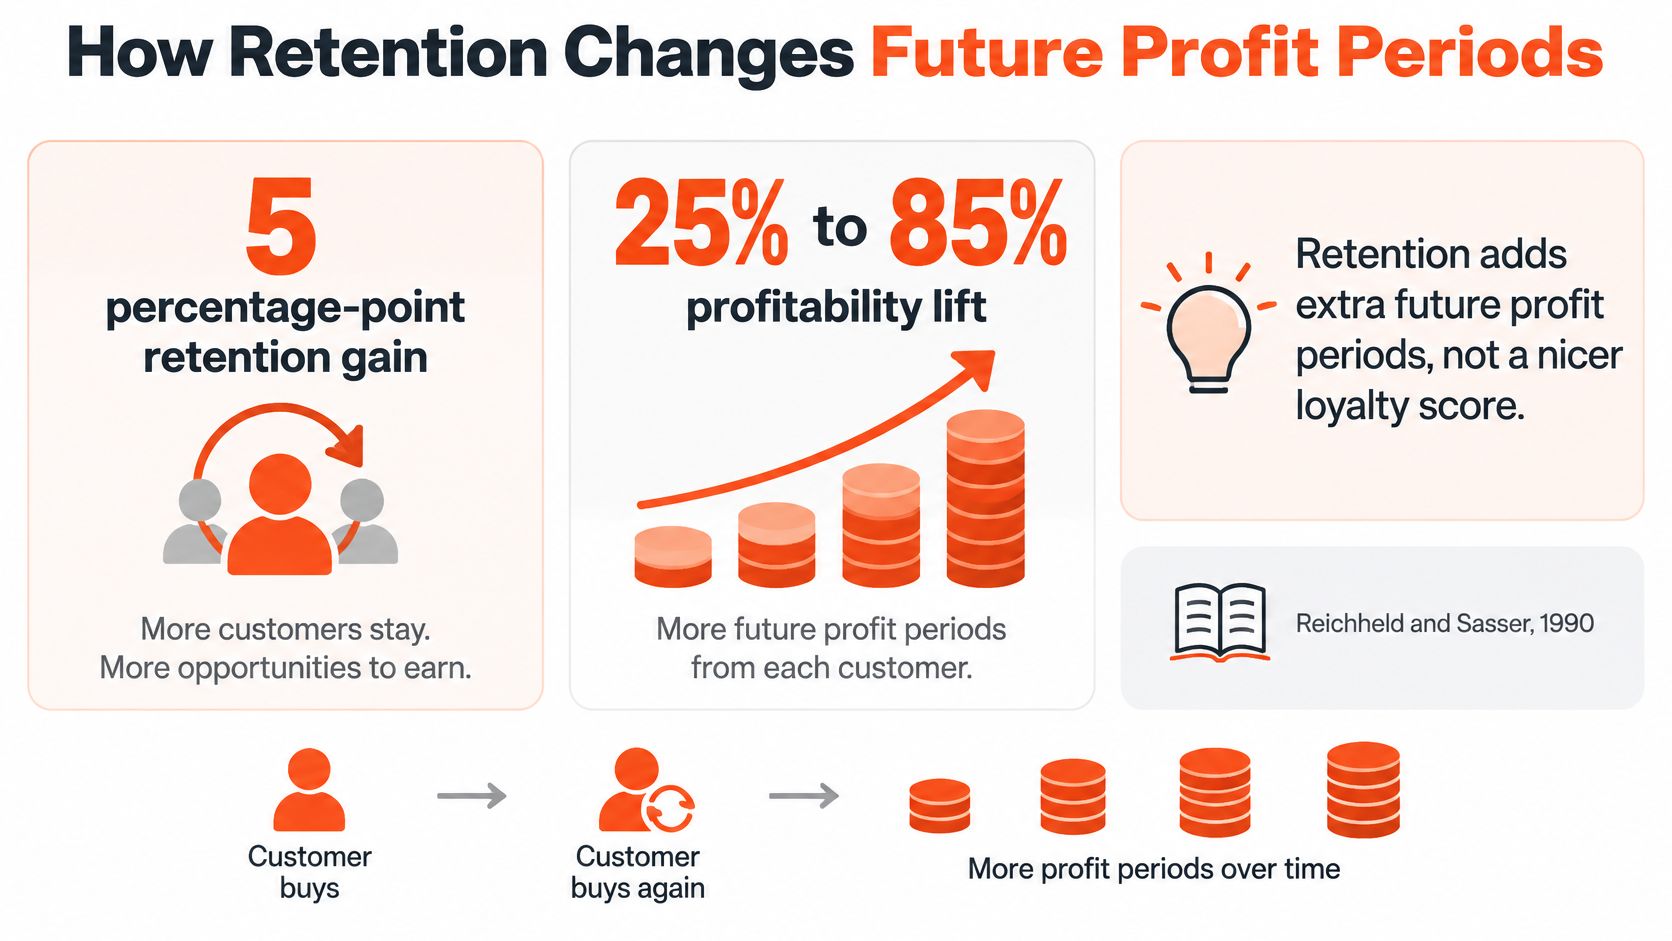
A five-percentage-point increase in retention could increase profitability by 25% to 85%, depending on industry economics, according to Reichheld and Sasser's finding summarized in the academic treatment of customer lifetime value by Ferrentino and colleagues. The same paper gives an illustration in which 80% retention and a 20% discount rate turn an initial €1 contribution into approximately €3 of long-term value.
Those aren't Shopify performance promises. They illustrate why retaining a customer can affect more than the next order: the customer may remain available for additional profitable purchase periods.
Improve the period, not just the repeat rate
In a constant-retention model, the relationship between retention and value is nonlinear. Higher retention increases the probability of receiving contribution in later periods, while discounting reduces what those distant periods are worth today.
The operational question is which intervention creates those periods without consuming their margin:
Second-order conversion: Help buyers use the product successfully before pushing another purchase. An immediate discount can accelerate an order without improving long-term demand.
Subscription renewal: Match delivery cadence to consumption. Excess inventory can lead to skips, cancellations, and avoidable support.
Replenishment timing: Use product and order history to estimate when a reminder is relevant. Sending too early can encourage stockpiling rather than durable retention.
Win-back: Diagnose why customers stopped. An incentive won't fix a product mismatch or an unresolved delivery problem.
A subscription model can make repeat purchasing easier, but recurring billing alone doesn't establish profitable retention. Shipping subsidies, subscriber discounts, payment failures, and service demands still belong in the economics.
A repeat order is useful only to the extent that the customer leaves contribution behind.
Separate behavioral gains from economic gains
Track retention alongside contribution by acquisition cohort and customer segment. A storewide repeat rate can improve because the acquisition mix changed, even when no existing segment became more loyal.
Keep the retention intervention visible in the cohort ledger. If an offer generates more orders but lowers contribution per acquired customer, don't use the order lift to justify a higher acquisition ceiling.
Require the improvement to persist across subsequent purchase cycles before treating it as a durable planning input. Temporary promotional behavior isn't a stable retention assumption, and a forecast shouldn't capitalize it as though it were.
Uncertainty Cold Starts and Calibration Checks
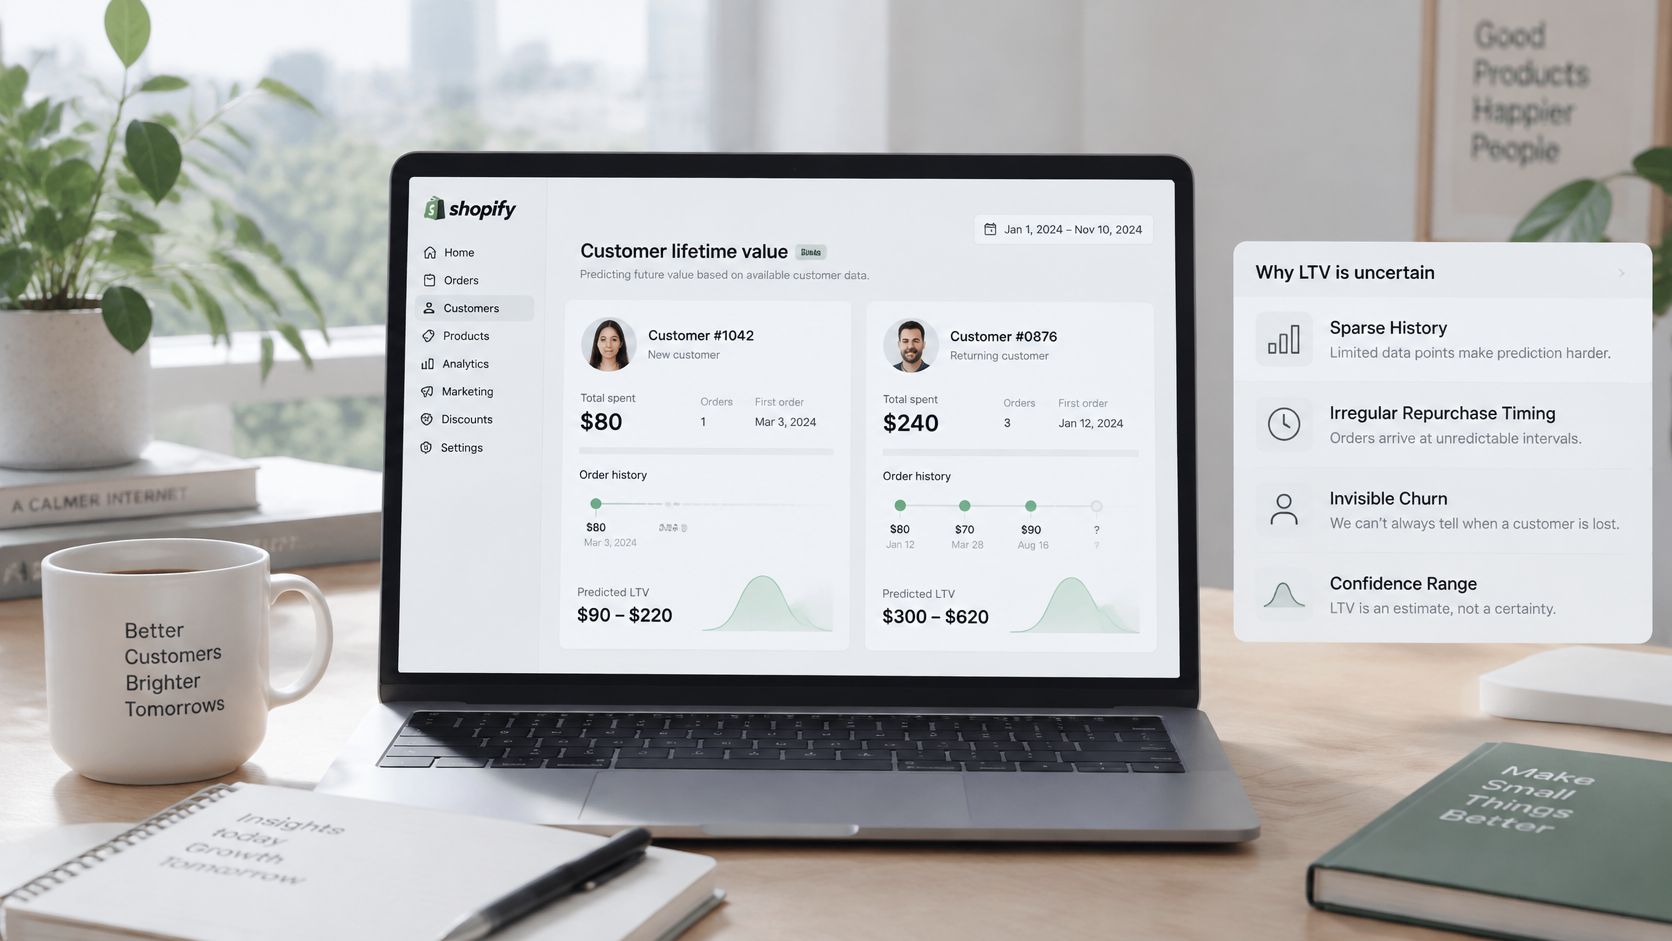
A single CLV score can look precise without being reliable. A large first order might represent loyalty, a gift, a promotion-driven stock-up, or a purchase the customer later returns. The model can't resolve those possibilities from the order total alone.
Keep uncertainty visible wherever the team reads the forecast.
Publish a range and a provenance
A comparative ecommerce CLV study available through EconStor finds consistent performance from BG/NBD and Pareto/NBD across online-retail datasets, while showing that model choice affects forecasts and that adding nonfinancial behavioral information doesn't always justify its collection cost.
That's a reason to validate complexity, not reject it. Browsing events, email engagement, and quiz responses should earn their place by improving out-of-sample decisions.
For each customer or cohort, publish:
Observed contribution: Reconciled value already generated.
Forecast contribution: Expected remaining value over a named horizon.
Uncertainty range: A model-derived prediction interval, or clearly labeled planning scenarios if the method doesn't produce one.
Model status: Mature history, limited history, or cold start.
A cold start means the buyer hasn't generated enough behavior for a dependable individual estimate. Use a cohort-based expectation rather than presenting a personalized rank with false confidence.
Backtest the decision
Freeze predictions at the date they would've been used, then compare them with realized contribution at 90 days, 180 days, and 12 months. Check calibration by acquisition source and value band, not just the storewide average, where overestimates and underestimates can cancel out.
Keep the validation walkthrough separate from the live forecast.
Don't leak later refunds or purchases into the training snapshot. That makes historical performance look better than the forecast would've been in practice.
A Shopify store audit can help identify whether broken tracking, missing subscription events, or inconsistent customer records are undermining the inputs. Fix those issues before buying a more advanced model.
Budget guardrail: If plausible forecast error reverses the acquisition decision, keep the spend test constrained until more evidence arrives.
The output should support cautious action, not merely a ranked export. Otherwise, teams can overspend on impressive first orders or cut acquisition before younger cohorts have had time to mature.
How to Build CLV from Shopify Order Data
Start with a spreadsheet or a warehouse query your analyst can reconcile. You don't need a data-science stack to create a useful contribution-based cohort model, but you do need consistent definitions and an audit trail.
Use the workflow below as an accounting-to-activation process, not just an order-value calculation.

Build the contribution ledger
Export identifiable order records. Include customer ID, order ID, order date, gross sales, discounts, refunds, shipping charged, and acquisition source where available. Keep test orders and canceled orders identifiable rather than deleting them.
Calculate contribution per order. Subtract discounts, refunds, product costs, payment fees, fulfillment costs, shipping costs, and attributable variable service costs. Add shipping revenue when appropriate, exclude pass-through taxes, and ensure discounts haven't already been deducted from the exported sales field.
Assign the acquisition cohort. Find each customer's first valid order and store its month and source. Use a stable customer ID rather than email alone, and document how merged accounts and guest purchases are handled.
Aggregate behavior at equal customer ages. Calculate acquired buyers, repeat buyers, orders per buyer, contribution per order, and cumulative contribution per original buyer. Choose observation windows that reflect the product's replenishment cycle, and retain nonrepeaters in the denominator.
Add forecasts and decision checks
Distinguish completed windows from forecasts. Use actual contribution only when a cohort has fully reached the relevant age. For younger cohorts, apply a mature cohort's curve only when product mix, pricing, acquisition conditions, and subscription structure are sufficiently comparable.
Apply acquisition cost consistently. Allocate fully loaded acquisition spending by source and cohort using a documented attribution rule. Report contribution before CAC alongside net value after CAC so the acquisition team doesn't subtract the same cost twice.
Reconcile and backtest. Save forecast snapshots, compare them with subsequently realized contribution, and record whether the error would've changed the CAC decision. Investigate systematic misses before changing the model's complexity.
Activate only actionable fields. Write cohort, predicted remaining contribution band, forecast confidence, and subscription status to Shopify customer metafields or your email platform. Include the score date and model version so an old prediction doesn't trigger a current campaign.
Late refunds require special care. If the export omits them, contribution will be overstated; if it omits off-platform subscription renewals, contribution will be understated. Join both back to the correct customer and purchase history.
Document missing costs rather than treating them as zero. A model with an explicit limitation is safer than a clean-looking sheet that assumes fulfillment, returns, or customer support are free without stating it.
Spend Only Where Incremental Margin Wins
Contact a customer only when expected incremental contribution exceeds message, incentive, and additional operating costs. Measure that increment against a randomized holdout, not against the customer's purchase history or the campaign's attributed revenue.
A 2025 operations-research study on profit-driven churn prevention found that individual CLVs produced the strongest average performance across 13 churn-prediction datasets, compared with aggregated average CLVs. That supports using customer-level economics, but it doesn't make a high score sufficient evidence for an offer.
When a CLV score should change spend
Customer state | Wrong move | Spend rule |
|---|---|---|
High CLV and likely to repurchase anyway | A retention discount | Don't pay for a sale that was coming |
Lower CLV but persuadable in a holdout | Ignoring them because the score is low | Target only if incremental margin beats contact and incentive cost |
New buyer with one order | An individual lifetime rank | Use the cohort curve until repeats exist |
Failed payment or involuntary churn | A win-back promo | Fix dunning and payment recovery first |
Explicit cancel or downgrade | The same offer for every churn type | Test a save offer against a holdout and the margin left |
Match the intervention to the cause
Voluntary cancellation, failed-payment churn, dormancy, and downgrading require different responses. Payment recovery addresses billing failure. Cadence changes may address excess inventory. A blanket coupon doesn't diagnose either problem.
Use Shopify A/B testing to compare contribution per eligible customer between treatment and holdout groups. Include incentive costs across all treated orders, including orders that would've happened without the campaign, and allow enough observation time to detect purchases merely pulled forward.
For Acure, we enhanced account functionality to support reorder behavior and lifecycle engagement, and refined subscription and promotional logic. Our ongoing work focuses on lifecycle segmentation, subscription refinement, and continued CRO testing. Those are operational changes to evaluate economically, not proof that every retention offer deserves more budget.
Start by auditing an acquisition cohort's second-order contribution after discounts and returns. Raise allowable CAC only when the resulting economics, including the intervention cost and forecast uncertainty, support the increase.
Presidio helps Shopify teams improve subscription experiences, lifecycle segmentation, and conversion journeys through maintainable development and ongoing optimization. Visit Presidio to discuss a contribution-led retention roadmap that connects customer data, controlled testing, and acquisition decisions.

Jamie, Presidio’s Designer, leads the practice alongside Johnnie. With over 10 years of e-commerce experience, Jay is a Shopify expert, known for crafting innovative solutions that prevent tech debt.
Jaime
Senior Product Designer, 2020