Presidio

The most popular advice about conversion rates in ecommerce is also the least useful: find the industry average, compare your store with it, and decide whether your number is “good.” That approach hides more than it reveals. A blended rate combines traffic intent, device mix, product category, price, geography, returning-customer behavior, and checkout usability, so two stores can report the same percentage while having completely different problems.
Baymard's review of 50 published studies found an average documented cart abandonment rate of 70.22%, with individual studies ranging from 55.00% to 84.27% because methodologies, markets, devices, categories, and purchase intent differ. That's a useful warning about benchmark interpretation, not a universal target for every Shopify store. The practical path is to measure the metric correctly, build a segmented baseline, locate the largest drop-off, fix friction in priority order, and judge the result with revenue-oriented KPIs.
Table of Contents
Why Your Ecommerce Conversion Rate Needs Context
A conversion rate isn't a grade assigned to your storefront. It's an output produced by the quality of the people arriving, the relevance of the offer, the device they use, and the amount of effort required to buy.
A store selling a considered, high-priced product may have a lower session-based rate than a replenishment business, even when both deliver a strong customer experience. A campaign that brings cold social traffic can lower the blended rate while expanding future demand. Conversely, a high rate may only reflect branded visits, repeat customers, or a narrow audience with strong purchase intent.
The benchmark problem
Published ecommerce benchmarks commonly range from 1.7% to 3%, but no probability-sampled global website conversion-rate study establishes one universal standard, as discussed in this conversion-rate benchmark synthesis. The variation isn't a nuisance around one correct answer. It's evidence that the denominator and audience mix matter.
Baymard's cart-abandonment research makes the same point from another angle. Its meta-average spans studies with materially different results, so comparing your cart behavior with one headline number can create false urgency or false confidence. Cart abandonment also starts after a shopper has added an item, while ecommerce conversion rate usually compares completed orders with sessions or visitors. They aren't interchangeable.
Practical rule: Use an industry benchmark as a prompt to investigate, never as the KPI that decides whether your store is healthy.
What a useful diagnosis looks like
Start with the blended number, but don't stop there. Separate new and returning shoppers, mobile and desktop, acquisition source, geography, product category, and checkout type. Then ask where the largest absolute loss occurs and whether the problem is weak intent, poor landing-page alignment, confusing merchandising, or checkout friction.
This diagnosis-first approach is more useful than redesigning a homepage because a blog says the average store converts higher. For a broader overview of practical interventions, Headline Marketing Agency's conversion guide is a helpful supplementary resource. The central discipline remains your own funnel, measured consistently over time.
How to Measure Ecommerce Conversion Rates Correctly
The standard session-based formula is simple:
Conversion rate = completed orders ÷ sessions × 100
The difficult part is deciding what counts as an order, what counts as a session, and whether the denominator matches the question you're trying to answer. Orders divided by unique visitors produce a different rate from orders divided by sessions, because one person may return several times before purchasing.

Establish a trustworthy denominator
For routine Shopify reporting, pick one primary definition and document it. Session-based conversion is useful for operational comparisons when the tracking rules stay stable. Visitor-based conversion can better describe how many people purchased, but it requires reliable identity resolution and consistent consent handling.
Cart abandonment answers a narrower question:
Cart abandonment rate = carts without completed orders ÷ created carts
It shouldn't be presented as your overall site conversion rate. Many visitors never add a product, and some cart users are comparing options, saving items, or waiting for a later purchase. Treat the metrics as different stages of the same leaky bucket.
Audit the event chain
Check that the following events fire once and only once:
Product interaction: Product views and variant selections are recorded with the correct product identifiers.
Cart activity: Add-to-cart and cart updates reflect actual item quantities, not every interface click.
Checkout progression: Checkout start, shipping details, payment information, and purchase events remain distinguishable.
Order confirmation: The purchase event fires on the completed order state and includes the correct value, currency, and order identifier.
Then exclude internal traffic and obvious bot activity where your analytics setup permits it. Reconcile analytics orders with Shopify orders, investigate duplicated purchases, and split one-time transactions from subscription orders when those journeys behave differently. Returning customers also deserve their own view, since repeat purchase behavior can make a blended rate look stronger without telling you whether acquisition traffic is working.
Teams planning scaling DTC conversion performance should also report the denominator beside every rate. A dashboard that shows “conversion rate” without saying sessions or visitors invites bad decisions.
Building a Segmented Baseline Instead of Chasing Averages
The useful question isn't “What is a good ecommerce conversion rate?” It's “What should this traffic, product, device, and customer cohort reasonably do on this store?”
Build the baseline from your own data. Start with a consistent reporting period, then segment the result by new versus returning users, device, source, geography, product category, subscription status, and checkout type. Keep the same definitions across periods so a tracking change doesn't look like a performance change.
Read the mix before judging the result
A falling blended rate can be healthy if newly acquired traffic is colder than the existing audience and the underlying segment rates remain stable. A high blended rate can be misleading when branded search and returning users dominate. The headline number changes as the weights change, even if the storefront and checkout haven't changed.
Published averages vary for the same reason. Vendor panels, industries, geographies, device mixes, and conversion definitions differ. Baymard's cart-abandonment average across 50 studies, ranging from 55.00% to 84.27%, demonstrates how methodology affects the apparent baseline. Don't compare your blended session rate with a visitor-based benchmark and call the difference a UX problem.
Use segment patterns to choose the next investigation
Pattern in Your Data | Likely Cause | Recommended Intervention |
|---|---|---|
Mobile underperforms desktop mainly after checkout starts | Interaction, form, payment, or accessibility friction | Reproduce checkout on real phones, inspect errors, and test payment presentation |
One paid source has weak product-page engagement while other sources perform normally | Message and landing-page mismatch | Align ad promise, landing content, product selection, and offer |
New users lag while returning users are healthy | Trust, product understanding, or acquisition quality gap | Improve first-visit education, reviews, policies, and source-level landing experiences |
One product category has strong add-to-cart but weak checkout completion | Fulfillment, price, shipping, or variant uncertainty | Review total-cost disclosure, delivery expectations, inventory states, and variant UX |
Every segment drops at the same funnel step | Instrumentation issue or sitewide friction | Validate events first, then audit the shared interface and checkout component |
Blended rate falls while new-user share rises and segment rates hold | Traffic-mix change | Evaluate acquisition quality and revenue per session before redesigning |
This table turns benchmarking into triage. Analytics tells you which segment deserves attention, while qualitative research explains what shoppers encountered. For Shopify Plus teams, the baseline should also distinguish markets and checkout configurations because payment availability and fulfillment expectations can vary sharply by region.
Diagnosing Where Shoppers Actually Drop Off
Baymard's review reports a 70.22% average documented cart-abandonment rate, which means roughly 7 out of 10 carts don't become completed orders. That figure establishes the scale of intent lost after cart creation, but it doesn't mean every abandoned cart represents a preventable failure. Some shoppers are comparing products, checking delivery options, saving a basket, or postponing a purchase.

Give every leak an address
Instrument the journey as a sequence rather than relying on the final conversion rate:
Landing or product view: Did the visitor reach a relevant page?
Add to cart: Did the offer, price, availability, and product information create enough confidence?
Checkout start: Did the cart make the next step clear?
Shipping details: Did delivery cost and timing create hesitation?
Payment information: Did the shopper find a trusted, usable payment method?
Purchase: Did the order complete without an error, redirect problem, or tracking failure?
Calculate progression by segment, then look at absolute losses. A small percentage drop in a high-volume step can matter more than a severe drop in a low-volume step. This is why a homepage redesign often loses to a focused fix on a heavily used product template or checkout field.
Pair behavior with explanation
Quantitative data locates the problem. It rarely explains it.
Use session recordings to watch shoppers who abandoned at the relevant step, but sample deliberately. Compare successful and unsuccessful sessions on the same device, source, and product type. Look for repeated behaviors such as backtracking to shipping information, tapping disabled buttons, reopening variant selectors, or encountering validation errors.
Support tickets and live-chat transcripts add a different layer. Customers may mention delivery costs, unclear returns, payment failures, or confusing sizing in language that analytics can't capture. The Shopify cart abandonment analysis can provide additional context, but your own event data should decide which issue gets priority.
The diagnostic distinction: An intent gap means shoppers weren't ready or weren't the right audience. A friction gap means motivated shoppers tried to proceed and the experience made completion harder.
Don't treat every abandoned cart as a design defect. Identify the step, isolate the segment, confirm the repeated behavior, and then test a fix that addresses the observed cause.
Removing Checkout Friction That Suppresses Orders
Checkout friction is a measurable commercial constraint, not a matter of visual taste. Baymard reports that its large-scale checkout testing indicates the average large ecommerce site could achieve a 35.26% increase in conversion rate through better checkout design and usability, with an estimated $260 billion in recoverable revenue when applied to combined U.S. and European ecommerce sales of $738 billion. These are modeled opportunities, not promises for an individual Shopify store.
The abandonment causes tell you where to start. Baymard's U.S. shopper survey found that 48% abandoned because extra costs were too high, 24% because account creation was forced, 22% because delivery was too slow, 18% because they didn't trust the site with card information, and 17% because checkout was too long or complicated. The ranking supports a practical order of operations.

Fix the uncertainty shoppers encounter first
Show the full cost early. Shipping, taxes, and fees shouldn't appear as an unpleasant surprise at the final step. Add delivery estimates and cost rules where shoppers make the cart decision, while keeping the final total consistent.
Make guest checkout obvious. Account creation can follow the order. Don't make a shopper create credentials before they can pay, especially when the account's value hasn't been demonstrated.
Set honest delivery expectations. If fulfillment is slow, state it before checkout. A clear delivery window can preserve trust even when the promise isn't immediate. A vague or late disclosure creates a more damaging surprise.
Reduce field effort. Remove fields that don't support fulfillment, payment, compliance, or customer service. Use address autocomplete and solid error recovery, but don't let autocomplete hide what a shopper entered.
Present trusted payment choices. Payment availability was cited by 9% of respondents as an abandonment cause, while site errors or crashes were cited by 13%, according to Baymard's checkout usability statistics. Offer the methods your customers use, make failure states recoverable, and don't bury alternative payments below a long form.
Clarify returns before payment. Return uncertainty can stop a purchase even when the product is appealing. Put the policy near the decision point, explain exclusions plainly, and make the post-purchase process easy to find.
Baymard's benchmark of 344 leading U.S. and European ecommerce sites found that 65% had checkout usability rated mediocre or worse, while only 2% were rated good. The average site had approximately 32 documented checkout improvements available, so a checkout audit often produces a more actionable backlog than another round of decorative interface changes.
The Shopify checkout optimization guide is useful when translating these principles into theme, extensibility, payment, and checkout-configuration decisions.
Fixing the Mobile Conversion Gap Through Accessibility
“Mobile converts worse” is an observation, not a diagnosis. The actionable question is which interaction failures stop a motivated shopper from completing the task.
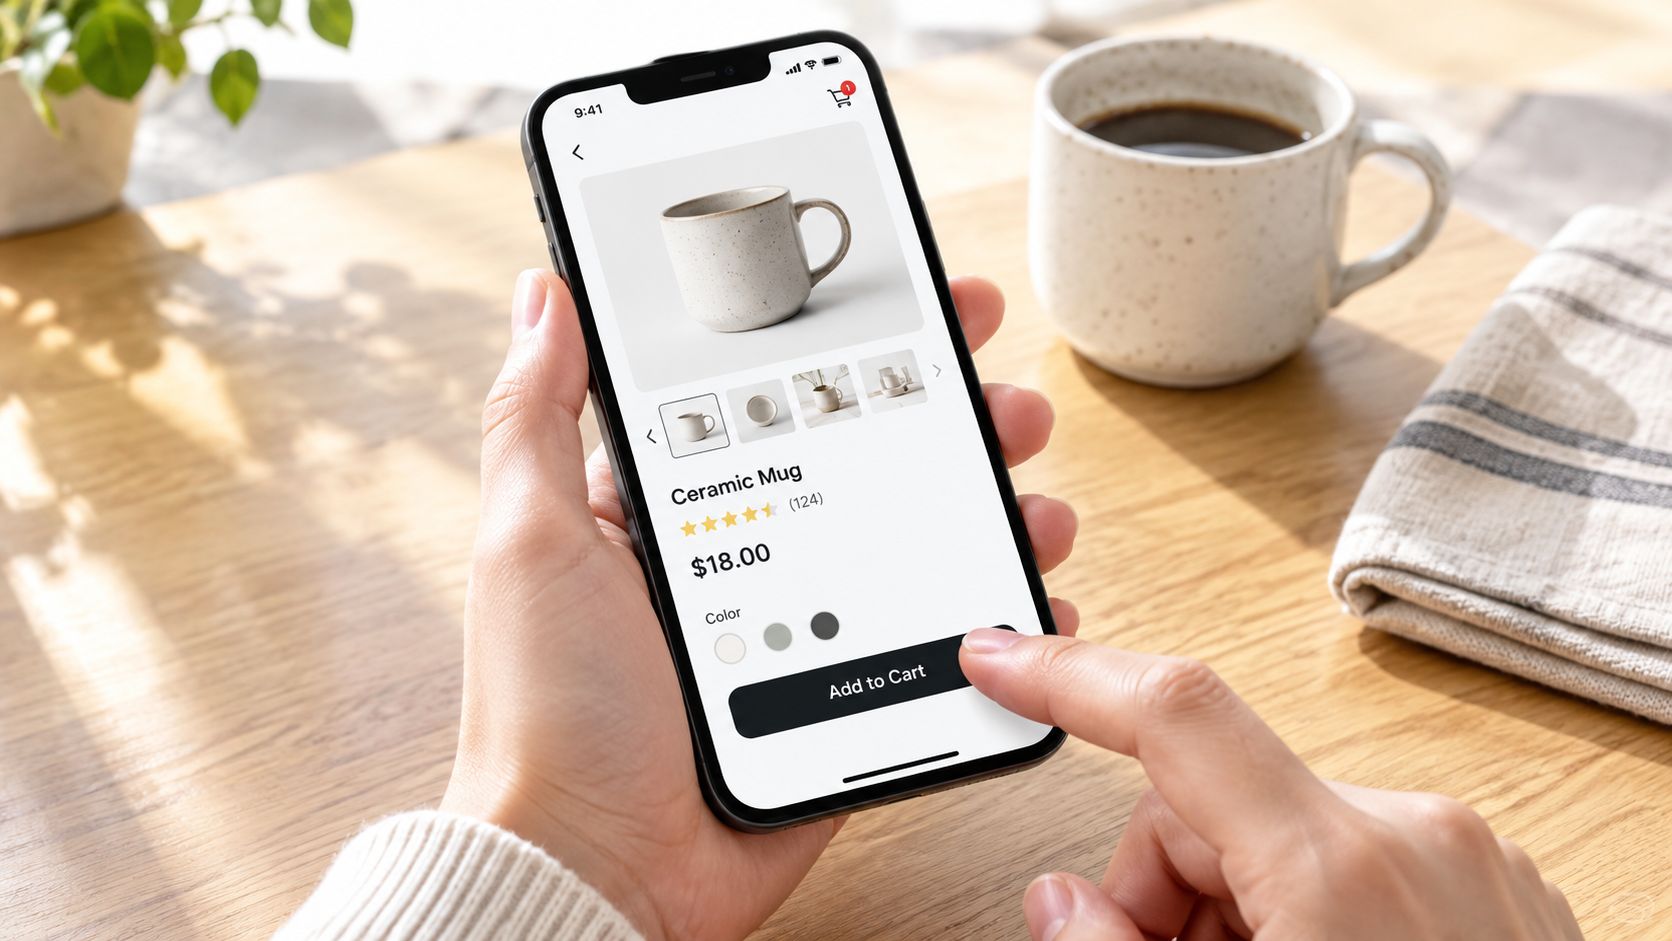
Recent benchmark coverage reports that mobile represented roughly 76% of ecommerce visitors, while mobile cart abandonment reached 81.72% in April 2026. Those figures are time- and source-specific, so they shouldn't become a universal target. They do reinforce where many stores should investigate first: the small-screen journey, particularly forms, payment, error recovery, and performance.
Treat accessibility as revenue protection
The Contentsquare Foundation reported that 94% of Europe's top ecommerce sites had inaccessible checkout journeys. That makes accessibility a commercial concern, not a compliance task reserved for a later release. Missing labels, weak focus states, low contrast, small touch targets, broken keyboard behavior, and unclear validation can block disabled shoppers and also frustrate people using a small screen, poor connection, or unfamiliar device.
Audit the actual task, not just the static page:
Keyboard path: Can a shopper move through every field, control, modal, and error message without losing focus?
Screen-reader meaning: Do labels, button names, group relationships, and status messages describe the task accurately?
Touch tolerance: Can shoppers select variants, increase quantity, open shipping details, and submit forms without precision tapping?
Error recovery: Does the interface identify the failed field, explain the correction, preserve entered data, and return focus appropriately?
Autofill behavior: Do address and payment fields use meaningful names and compatible input types without creating duplicate or malformed values?
Visual clarity: Do contrast, zoom, sticky elements, and responsive layouts remain usable at checkout?
Test the journey people actually use
Run the same purchase on current phones, different browsers, slow connections, and assistive technologies. Pair those observations with funnel events, form-error rate, checkout completion rate, task time, and customer-support contacts. A change that looks cleaner but increases validation failures isn't a CRO win.
Maintainable theme architecture matters here. Semantic markup, predictable components, accessible form primitives, and limited third-party interference usually outperform cosmetic A/B tests when the underlying interaction is broken. Presidio's ADA accessibility requirements resource offers relevant guidance for teams turning accessibility findings into implementation work.
Audit standard: Reproduce the failure, record the affected segment, fix the underlying interaction, and verify completion behavior on the devices and technologies that exposed it.
Mobile optimization also requires restraint. A faster one-tap payment option can help, but it won't repair a payment field that loses focus, a delivery estimate hidden below an obstructive sticky bar, or an error message that appears outside the shopper's view. Fix the mechanics before polishing the presentation.
A Prioritized CRO Playbook and the KPIs to Track
A practical CRO program starts with diagnosis, not a backlog of fashionable tactics. Prioritize work by the size of the observed loss, confidence in the likely cause, implementation effort, and commercial value of the affected segment. A blended conversion rate can hide a serious mobile, acquisition, or returning-customer problem, so every decision should connect to a segmented baseline.
Put the work in the right order
First, instrument the funnel and segment the baseline. Confirm purchase events, define the denominator, reconcile order data, and report new versus returning users, device, source, geography, product category, and checkout type. Without this layer, a redesign can improve one segment while damaging another and leave the overall rate unchanged.
Second, fix high-impact checkout friction. Start with total-cost disclosure, guest checkout, delivery clarity, payment availability, form length, error recovery, and returns messaging. Test these changes against checkout completion and revenue, not only button clicks.
Third, improve the mobile foundation. Resolve accessibility defects, theme performance problems, layout instability, and third-party script interference. A clean component architecture often deserves investment before additional apps or cosmetic tests are added to a broken journey.
Fourth, improve discovery and relevance. After basic friction is controlled, work on guided selling, product comparison, merchandising, bundles, personalization, and tools such as AI-powered quizzes. These interventions are most useful when shoppers struggle to choose. They are less useful when checkout is still losing ready buyers.
Fifth, experiment with discipline. Define one primary outcome, one meaningful change, a consistent audience, and a decision rule before launch. Review results by segment and account for average order value, refunds, margin, and revenue per session. A higher conversion rate can still reduce commercial performance if the change attracts lower-value orders or depends on unsustainable discounts.
Track the metrics that explain revenue
Your dashboard should include:
Conversion rate: Orders divided by the documented denominator.
Add-to-cart rate: A signal of product-page relevance, offer clarity, and purchase intent.
Checkout completion rate: Orders divided by checkout starts.
Cart abandonment rate: The proportion of created carts that do not become orders.
Average order value: The value of completed orders, interpreted alongside discounting and margin.
Revenue per session or visitor: A broader view of traffic value than conversion rate alone.
Form-error rate and payment failure rate: Operational indicators that expose avoidable checkout loss.
Treat any vendor-published uplift figure as an opportunity estimate. Validate it against your own segmented baseline before committing engineering time. Test whether the proposed change addresses a measured loss in a commercially meaningful segment, then judge it by revenue and margin as well as conversion rate.
For additional tactical ideas on how to boost your store's conversion rate, compare recommendations against segmented evidence instead of adopting a generic checklist.
Start with the next two weeks
In the first few days, validate tracking and create the segment report. Then watch recordings and review support contacts from the largest funnel leak. During the second week, reproduce the failure on real mobile devices, make the smallest high-confidence fix, and define KPI guardrails before testing. Keep acquisition quality, average order value, and revenue per session in the same review.
How much improvement is achievable depends on who arrives, what they buy, how they pay, and how much friction already exists. Stores that improve consistently do not chase a published average. They give each loss an address, fix the highest-value problem, and measure what happened to revenue.
Presidio helps Shopify and Shopify Plus brands audit buyer journeys, improve storefront performance and accessibility, and build maintainable themes, apps, and testing roadmaps around measurable ecommerce KPIs. Visit Presidio to discuss a segmented CRO audit and a prioritized plan for your store.

Jamie, Presidio’s Designer, leads the practice alongside Johnnie. With over 10 years of e-commerce experience, Jay is a Shopify expert, known for crafting innovative solutions that prevent tech debt.
Jaime
Senior Product Designer, 2020